RED BULL FROM ½ PALLET · FREE UK SHIPPING FROM 1 PALLETWhatsApp +44 7999 150302 ↗

UK Energy Drinks Market 2026: What Independent Retailers Should Know
UK energy drinks market 2026: verified BSDA, NIQ, Talysis and ACS figures, plus original analysis on stock selection, profit, convenience retail and 2027 regulation.

TRIMAYU research briefing · Reviewed 12 November 2026 · UK retail and convenience market
The UK energy drinks market in 2026 is attracting plenty of attention, but the headlines can be difficult for an independent retailer to use. One report talks about sports and energy drinks overtaking cola. Another points to fast-growing flavours or premium cans. Neither tells you automatically how much Red Bull, Monster or another brand your own shop should buy next week. For a small retailer, the useful question is whether the category’s momentum can translate into more sales, better use of fridge space and stock that turns quickly enough to justify the cash invested.
We reviewed official British Soft Drinks Association figures, convenience-store EPOS research, NIQ market reporting and UK government guidance. The picture is encouraging, but it needs context. Sports and energy is often reported as one combined segment, while individual energy-drink brands are measured differently across sources. UK grocery, convenience-only data and the entire soft-drinks market are not interchangeable. Keeping those distinctions clear is the starting point for a credible retail buying decision.
UK energy drinks market 2026: five numbers worth understanding
The numbers below refer to specific markets and reporting periods. They are not TRIMAYU sales figures, and they should not be added together to produce an invented “energy drinks market size”. The 2026 British Soft Drinks Association report mainly describes sales that occurred in 2025; the convenience and NIQ figures include measured trading periods in 2026.
| Finding | Evidence | Where and when it applies |
|---|---|---|
| UK soft drinks value | £26.3bn | All soft drinks, UK, 2025; BSDA report published July 2026 |
| Sports & energy volume growth | +3.9% year on year | Combined sports and energy segment, UK, 2025; BSDA |
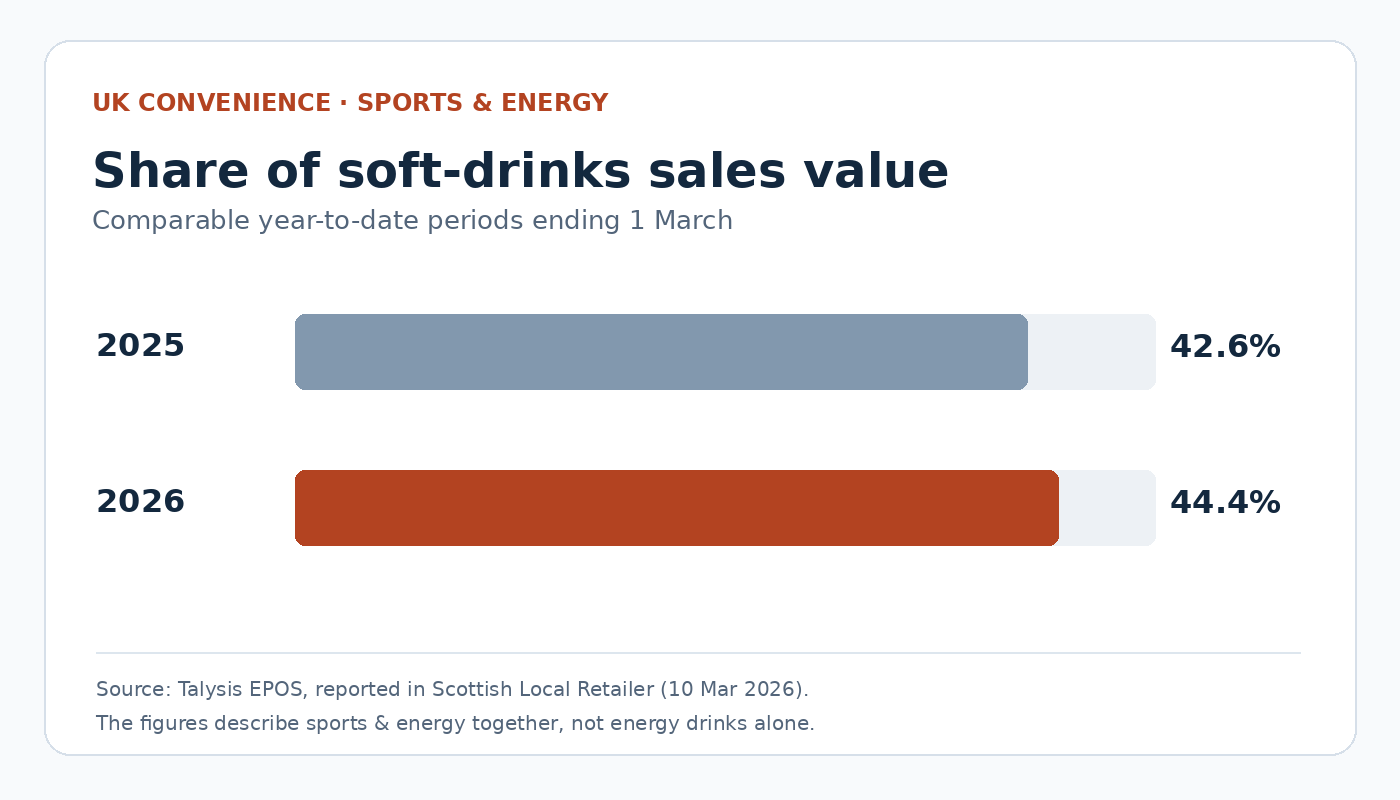
| Sports & energy share of convenience soft-drinks value | 44.4% versus 42.6% a year earlier | Year to 1 March 2026; Talysis UK convenience EPOS |
| Sports & energy versus cola, 12-week sales value | £675.2m vs £667.1m | NIQ soft-drinks market, 12 weeks ending 9 May 2026 |
| Forecast convenience-store sales, all categories | £49.1bn | UK convenience sector, 2026 forecast; ACS |
The sources are the British Soft Drinks Association’s July 2026 industry release, Talysis data reported by Scottish Local Retailer in March 2026, NIQ figures reported by The Grocer in June 2026 and the Association of Convenience Stores’ 2026 Local Shop Report. Read them as separate indicators: the £26.3bn total is all UK soft drinks, not energy drinks alone, and the £49.1bn forecast is all convenience-store retail sales, not beverage revenue.
Why sports and energy are taking more space in the convenience conversation
There is a genuine growth story here. The BSDA recorded a 3.9% rise in sports-and-energy drink volume during 2025, stronger than the 2.2% increase across total soft drinks. In convenience stores, Talysis reported that sports and energy accounted for 44.4% of soft-drinks sales value in the year to 1 March 2026, compared with 42.6% over the comparable previous period. That is a 1.8 percentage-point rise, calculated from the published shares, not a claim that 44.4% of every shop’s fridge should be allocated to energy drinks.
In the 12 weeks to 9 May 2026, NIQ also recorded £675.2m in sports-and-energy sales compared with £667.1m for cola. This was an important milestone over that 12-week window; The Grocer made clear that cola was still ahead across longer 26- and 52-week reporting periods at the time. It would be misleading to turn that result into the claim that energy drinks had permanently overtaken cola for the whole year. These figures are for the combined sports-and-energy segment, which includes products outside traditional high-caffeine energy drinks.
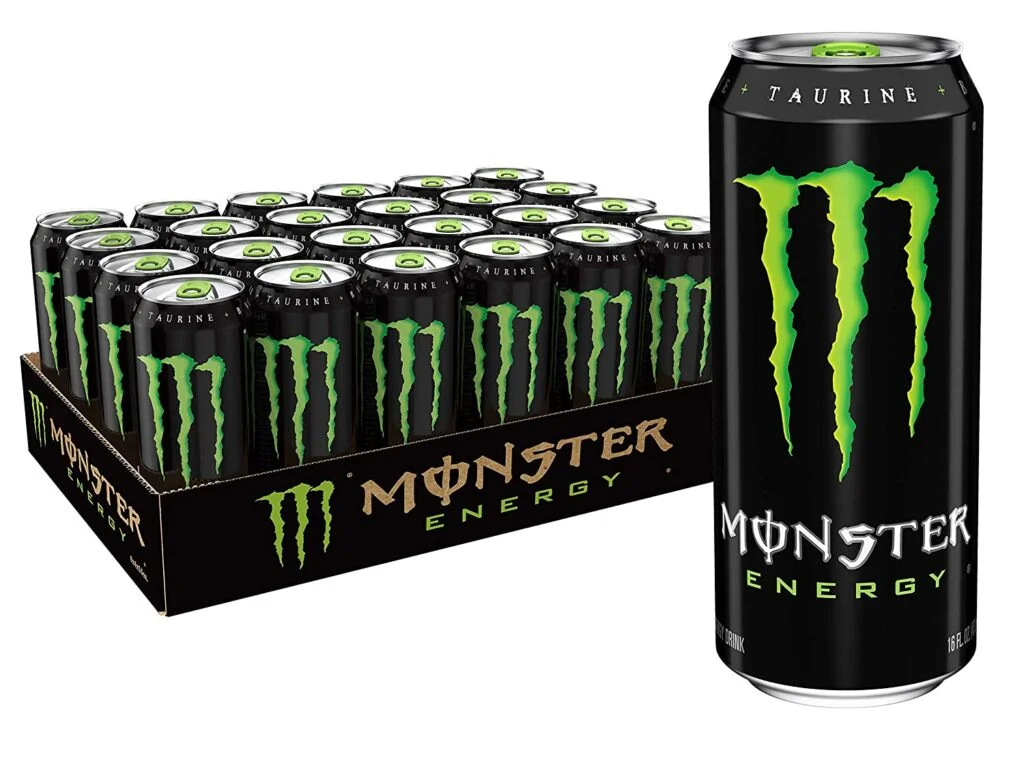
The takeaway for a shop owner is not “remove cola and stock only energy drinks”. It is that energy drinks deserve regular attention in your ranging, replenishment and chilled-space reviews. Even a fast-growing category can contain slow-moving flavours. Look at which individual SKUs your customers buy repeatedly and whether any current bestseller is regularly out of stock.
Original products still matter, but the flavour and zero-sugar range has changed
UK trade coverage highlights growth around familiar brands and innovation. Talysis’ 2025 convenience review, reported in March 2026, showed Monster contributing £92m of growth within its sports-and-energy analysis and highlighted launches including Monster Lando Norris and Monster Rio Punch. Its dataset also identified several Red Bull lines among the leading convenience SKUs. That is useful evidence of range depth, but it does not mean every special edition will sell in every shop or that a retailer should buy all of them by the pallet.
Core products such as Red Bull Original and Sugarfree or Monster Original and Ultra give a store a starting point for customer requests. Flavoured Editions, Juiced variants and new lines can create an additional reason to visit the fridge, but they should earn their space through repeat sales. If you stock too many flavours in equal quantities, your best performers may sell out while slower options absorb cash and shelf space. The sensible approach is to protect established demand first, then test emerging variants in quantities you can afford to rotate.
The low- and no-calorie trend deserves the same care. The BSDA’s 2025 report says 71.4% of the total UK soft-drinks market was low/no calorie by volume; its separate sports-and-energy category breakdown was 20.0% low/no calorie, 14.7% mid-calorie and 65.3% regular. These are different measures of different groups of drinks, so the 71.4% statistic must not be applied to energy drinks alone. For your shop, the meaningful question is how fast each sugar-free variant sells against its sugared equivalent—not how closely your shelf happens to match a national percentage.
Why high growth does not guarantee higher retailer profit
The ACS estimates UK convenience sales of £49.1bn for 2026, just 0.6% higher than the previous year, while retailers face sustained operating-cost pressure. The report also says industry investment dropped back to around £900m in 2025 and 2026 after exceeding £1bn in 2024. In other words, a category may be growing nationally while an individual shop is still struggling to fund stock, electricity, staffing and deliveries. A fashionable drink is not a good wholesale purchase if its cases sit in storage or its final landed cost leaves too little profit.
One simple measurement helps: weekly gross profit per chiller facing. Imagine two products occupying comparable display space in the same shop. Product A sells 36 cans per week at an illustrative gross profit of 45p each, producing £16.20; Product B sells 24 cans at 60p gross profit each, producing £14.40. Despite the higher margin per individual can, Product B contributes less total gross profit from that space. These numbers are hypothetical—not reported industry averages, TRIMAYU prices or recommendations. They demonstrate why a national growth chart should lead to a local test rather than an automatic full-pallet order.
| Hypothetical weekly test | Product A | Product B |
|---|---|---|
| Cans sold | 36 | 24 |
| Gross profit per can after allocated buying and delivery costs | £0.45 | £0.60 |
| Weekly gross profit | £16.20 | £14.40 |
| Comparable shelf facings | 1 | 1 |
When testing your own figures, use the same VAT basis for both products and include relevant freight or handling in the landed cost. Record any days when stock ran out, because a stockout will understate the rate of sale. If you want the full calculation, our wholesale drinks margin guide explains the difference between selling price, markup, gross margin and delivered cost.
TRIMAYU’s retailer scorecard: a practical four-week market test
A national report becomes useful when a retailer can turn it into a repeatable decision. For the next four weeks, choose no more than six to eight energy-drink SKUs that you already sell or want to evaluate. Include a mix of established lines and a small number of challengers. Record the units sold, days in stock, landed cost, selling price, chiller facings and remaining best-before window. You do not need sophisticated software: a spreadsheet updated at the end of each trading day is enough. The method below is TRIMAYU’s editorial analysis framework, not a formal study of shops or a claim of exclusive market data.
| Retailer signal | How to calculate or check it | Decision it supports |
|---|---|---|
| Rate of sale | Units sold ÷ days available for sale | Which SKU needs more reliable replenishment? |
| Gross profit contribution | Units sold × gross profit per unit | Which SKU helps pay for the space it uses? |
| Chiller-space productivity | Gross profit ÷ number of comparable facings | Which product earns more from scarce display room? |
| Stock cover | Saleable units on hand ÷ average daily unit sales | Is a larger order sensible or excessive? |
| Batch-date risk | Expected selling time versus confirmed remaining shelf life | Could the order become slow-moving or need discounting? |
| Unmet demand | Customer requests and days out of stock | Are you losing sales despite good recorded turnover? |
Review those measures at the same time each week and compare similar formats. A 250ml can and a 500ml can have different serving sizes, prices and uses, so their raw unit sales are not the whole story. Consider your shop’s location as well: a forecourt, railway-area convenience store and neighbourhood mini-market may attract different buying occasions. At the end of the test, expand only the lines that have demonstrated reliable sales and acceptable landed costs. Our drinks stock-planning guide takes the next step by showing how to turn an observed daily sales rate into a reorder point.
Wholesale pallets: match the order to demand, not a headline
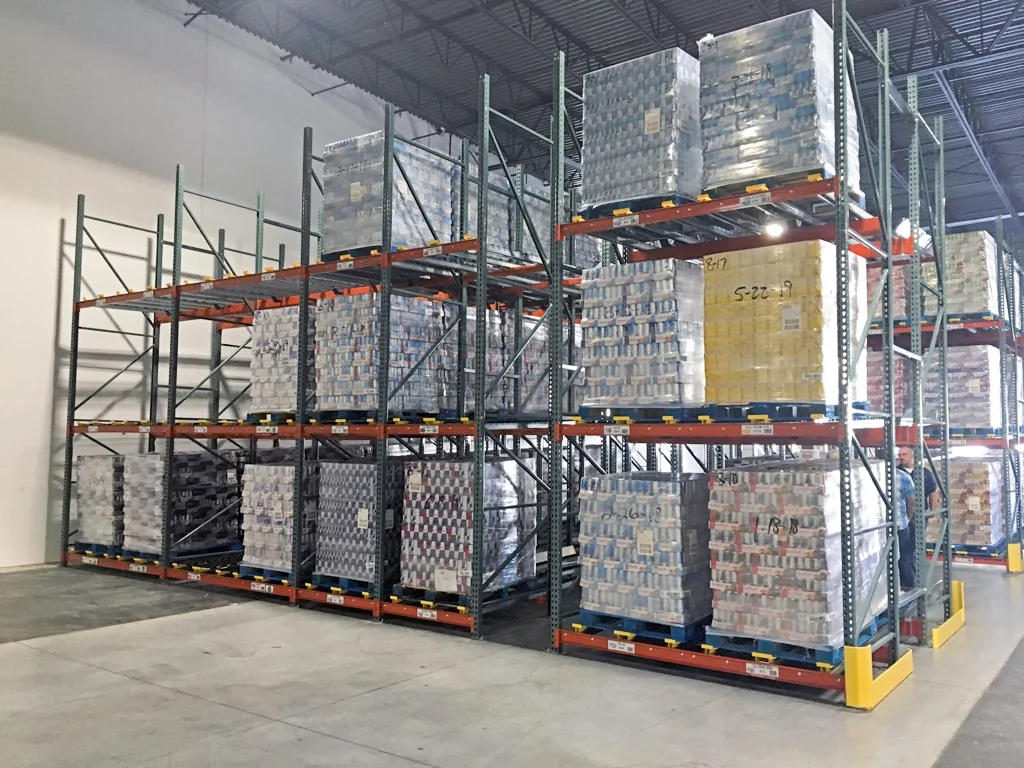
A full pallet may offer a clear case-price structure, but it can also create months of cover for a small shop. TRIMAYU’s published UK single-format references currently include 144 cases of Red Bull 24 × 250ml (3,456 cans) and 176 cases of Monster 12 × 500ml (2,112 cans). These are references for the named formats, not quantities that can be assumed for imported variants or a mixed physical pallet. The correct number is the one shown in the offered packing sheet and quotation.
For a shop selling 12 cans per day of a particular flavour, 3,456 cans represent 288 days of sales if the rate stays unchanged and there is no wastage; for a retailer selling 48 cans a day, the same volume represents 72 days. Neither example proves that the pallet is right for the business. The buyer still needs to assess storage, payment, cash flow, stock rotation and the batch’s actual remaining best-before window. If several flavours are needed, a mixed-energy-drinks ordering guide can help prepare the case list, while the supplier must approve whether a proposed assortment can be packed safely and what the final costs will be.
The 2027 policy change is part of the outlook
UK retailers should also plan for a change in the rules on selling high-caffeine drinks to children. In July 2026, the government confirmed its intention to prohibit retail sales in England to under-16s of drinks containing more than 150mg caffeine per litre, excluding tea and coffee. Implementation is intended for April 2027, subject to Parliamentary approval. The proposal applies to consumer sales, including online sales and vending machines, but not genuine business-to-business wholesale transactions. It is not correct to describe the rule as a completed UK-wide ban already in force. Read the official England consultation outcome and check the final legislation as it develops; the other UK nations have separate policy processes.
From a trading perspective, the sensible response is accurate product information and preparation, not abandoning the category. Verify caffeine declarations on the actual market pack, monitor developments in your nation and ensure retail staff understand which stock may require an age-of-sale check if and when the final rules commence. Our 2027 energy-drink age-restrictions guide explains the proposals in more detail and should be reviewed when the regulations are finalised.
What independent retailers should take into 2027
The strongest conclusion from the research is that sports and energy drinks are too important to ignore, but a bigger category does not remove the need for disciplined buying. Use the market evidence to decide which lines deserve a proper trial; use your own tills, landed costs and chiller space to decide which ones deserve a reorder. For some shops that will mean protecting Original and Sugarfree lines. For others, a well-chosen flavour may contribute more. The right answer comes from repeat sales and a viable gross margin, not from copying another retailer’s assortment or trying to stock every launch.
If you are comparing wholesale energy-drink formats, TRIMAYU’s trade range provides a starting point for Red Bull, Monster and other featured brands. Send an itemised wholesale quotation enquiry with your exact flavours, case formats, pallet quantity, minimum remaining shelf life and postcode. Current availability, physical packing and delivery terms need to be confirmed for the offered order. That is the final link between an interesting market report and a buying decision your shop can defend.
Sources and research method
Review date: 12 November 2026. This is an editorial synthesis of public, attributed research and an original retailer-analysis framework; TRIMAYU has not conducted a proprietary national consumer survey or purchased the underlying NIQ or Talysis datasets. Figures were taken from the BSDA 2026 industry release (covering 2025), Talysis EPOS data reported in March 2026 (UK convenience), NIQ figures reported by The Grocer (the 12 weeks to 9 May 2026), the ACS 2026 Local Shop Report and the July 2026 Department of Health and Social Care policy decision. Differences in geography, sales channel, category definition and measurement period mean the figures should not be treated as directly interchangeable. The example profits and stock-cover calculations are hypothetical and can be reproduced with a retailer’s actual trading data. Recheck market estimates and the status of the proposed England age restriction when updating this report.